|
Welcome to Skyepony's Weather Blog.
|


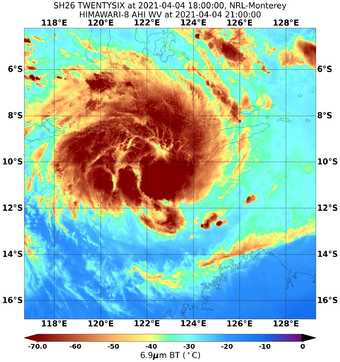
90S & 99S have become 27S & 26S respectively. 27S is on the left above & sits west of 26S off of Australia. 27S currently has winds of 35kts. It is forecast to strengthen to 65kts in 96hrs before weakening. 26S is more north of Northeast Australia. Currently it has winds of 45kts and is forecast to strengthen to 100kts in 96hrs and then begin to weaken. This storm may affect some islands in the next few days. Rain on the Farm It finally rained last Friday. Nearly 2 inches of precipitation fell, all at once. Later that night we had some long but healthy looking oak limbs cracked as the wind picked up. One fell, barely missing the bees. This hive moved in last fall, settling in a box that had been placed teetering on the precarious block pile. Had they not been moved they would have been hit by the smaller limb. A second larger limb is behind it, cracked and still hanging from the tree. It's time they got moved again and given an even better block base. 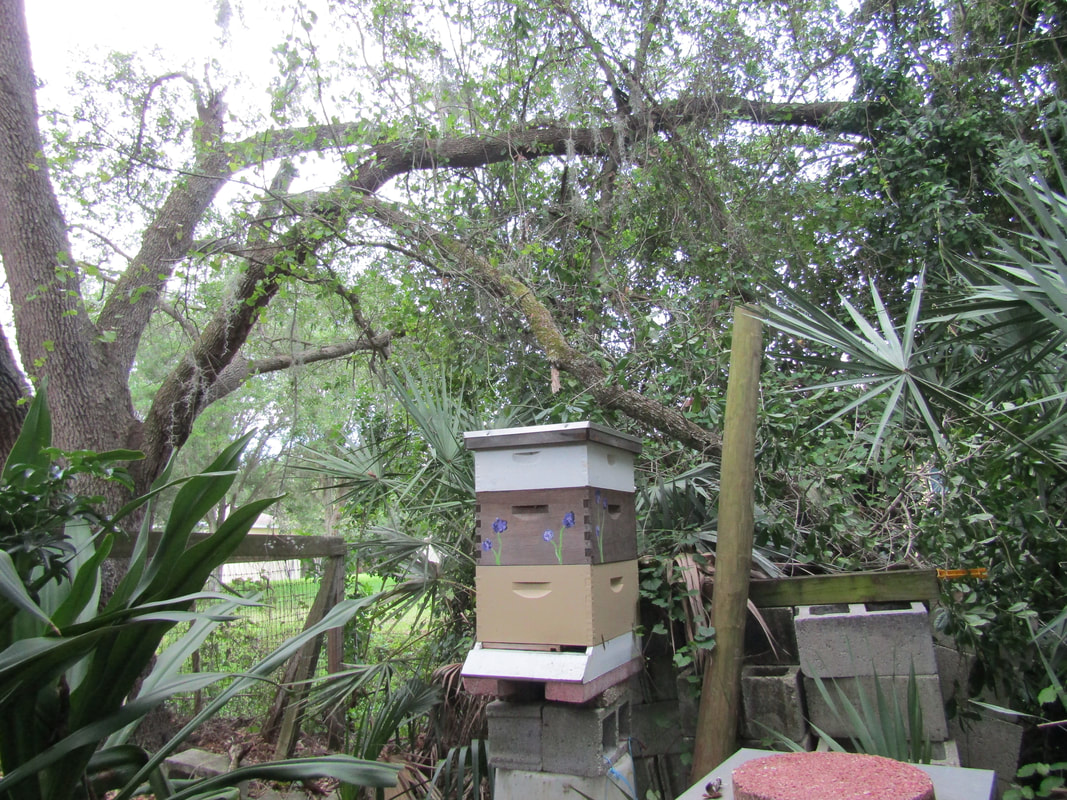 Had some dead fall to pick up out by the ditch as well. Yellow flowers were everywhere. Got to looking closer. It was peanut hay. Had sown some seeds in a sunny spot along the ditch hoping to get it established somewhere the herd couldn't eat it all. It is a low ground cover that doesn't need mowed, released to the public by UF Agricultural Extension. The plant needs little water and care so seemed like the ideal placement. It certainly has flourished with neglect and has already produced bean like seed pods near ready to harvest. Collected a few of the flowers for an Easter arrangement. 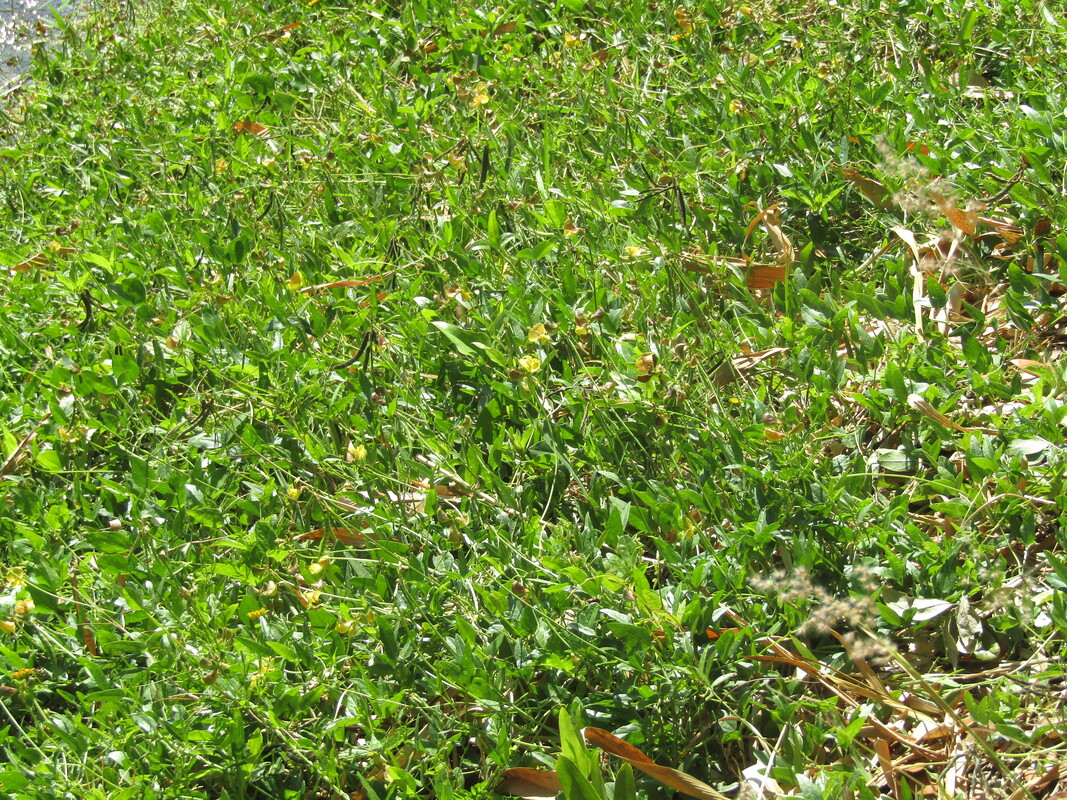 Perennial Peanut Hay is not just a favorite of the grazing livestock, the bees are enjoying this plant now that it is established and not just arriving as bales of hay. 
Comments
It's that time of year to attempt to peer past the spring barrier, to glimpse at what ENSO may hold and some possible general weather patterns for the rest of the year. As of March 29th La Nina was present with Region 3.4 at -0.6C. NOAA currently gives a transition this spring to neutral ENSO conditions, a 60% change of developing. In recent weeks the negative temperature anomalies in the Pacific Ocean have warmed some and then cooled again slightly. Generally looking at potential and existing Kelvin Waves, this sort of equatorial wave could change the winds and let the warm water in the West Pacific slosh back to the east. This time of year cyclones from north of Australia to Africa, especially when two or more start pairing up and straddling the equator can cause a Kelvin Wave to get started. 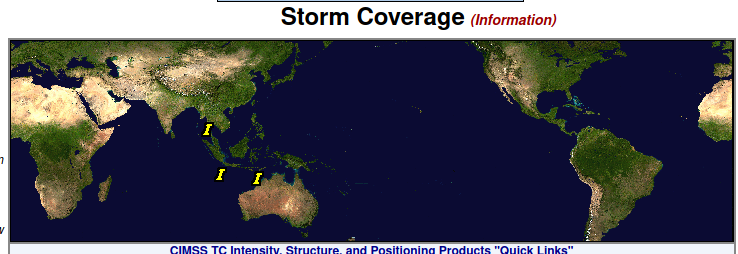 Figure 1 shows that is what the tropics are currently attempting, but the storms have been weak. The I's are for invest, areas of interest and have yet to organize. 90B is in the Northern Hemisphere. 90S is below it in the Southern Hemisphere, 99S is to the east, just offshore of Northeast Australia. All three storms have struggled for about 2 1/2days. These storms were proceeded by another cluster of storm a little farther west that never developed. No Tropical Cyclones have managed to form and pull it together enough to be named in weeks. 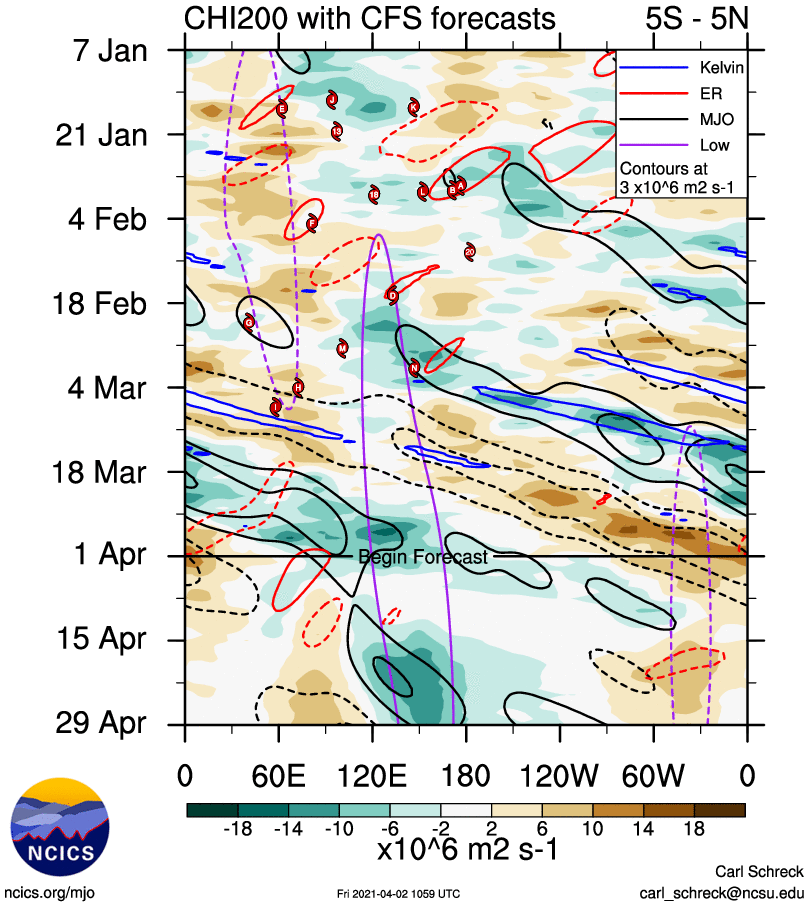 Figure 2. Potential Velocity thru time (vertical axis by date), across the Earth (horizontal axis by longitude). Storms best form when Potential Voracity is positive (brown). Kelvin Waves (blue), Equatorial Rossby Waves (ER marked in red), Madden–Julian Oscillation (MJO in black) and general areas of Low Pressure (purple) all help develop storms. Looking at the CFS forecast, strong storms don't look as likely to form in April, particularly in the area needed to kick up Kelvin waves.  Image 3 is the Equatorial Temperature Anomaly of the Pacific Ocean by depth. The top represents the surface where as the bottom is 450m deep in the ocean. This shows some sloshing taking place and heat moving below the surface weakening the current La Nina state. The heat started with quite high temperature anomalies. Those too were weakened. This is probably where some of the forecasts for Modoki La Nina summer are coming from. If that heat around 120W comes to the surface, a cool pool will likely be left out in the Central Region 3.4 while the eastern half warms. 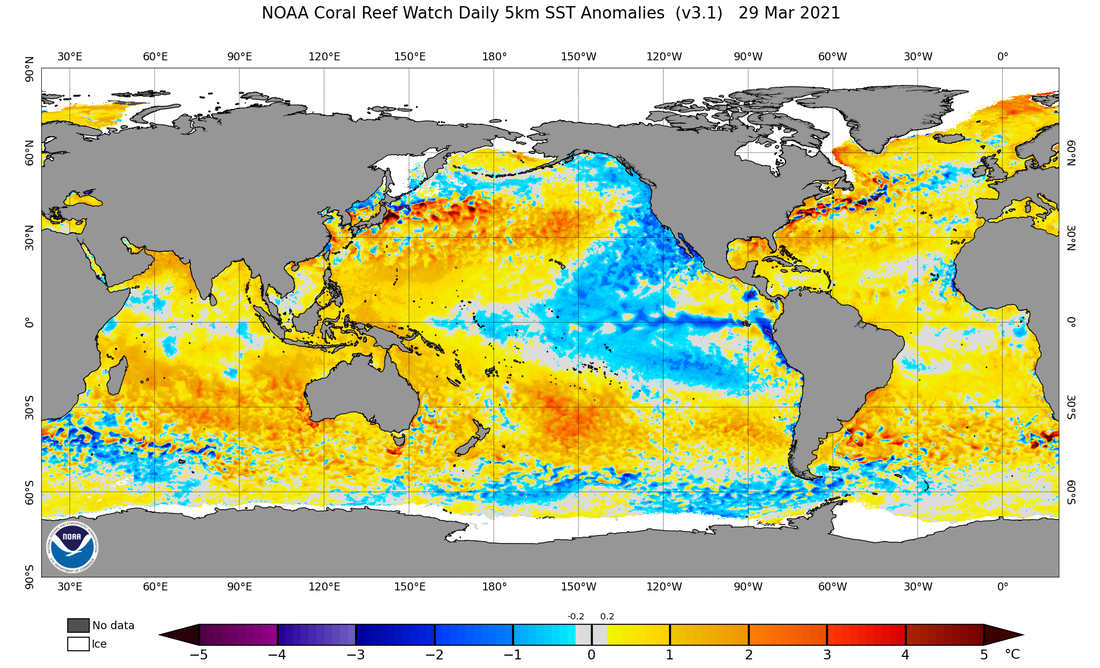 Image 4 shows the source of the La Nina, the cold water coming up along South America, being swept out along the equator from there forming well established Tropical Instability Waves . It was cut off a few weeks ago. Region 1.2 (the farthest East Pacific) had an abrupt warming to 0.8C and then quickly dropped to -0.8C over the month of March. If this current wind current flow continues La Nina would continue and most likely strengthen. If it stops this could all warm fairly fast. 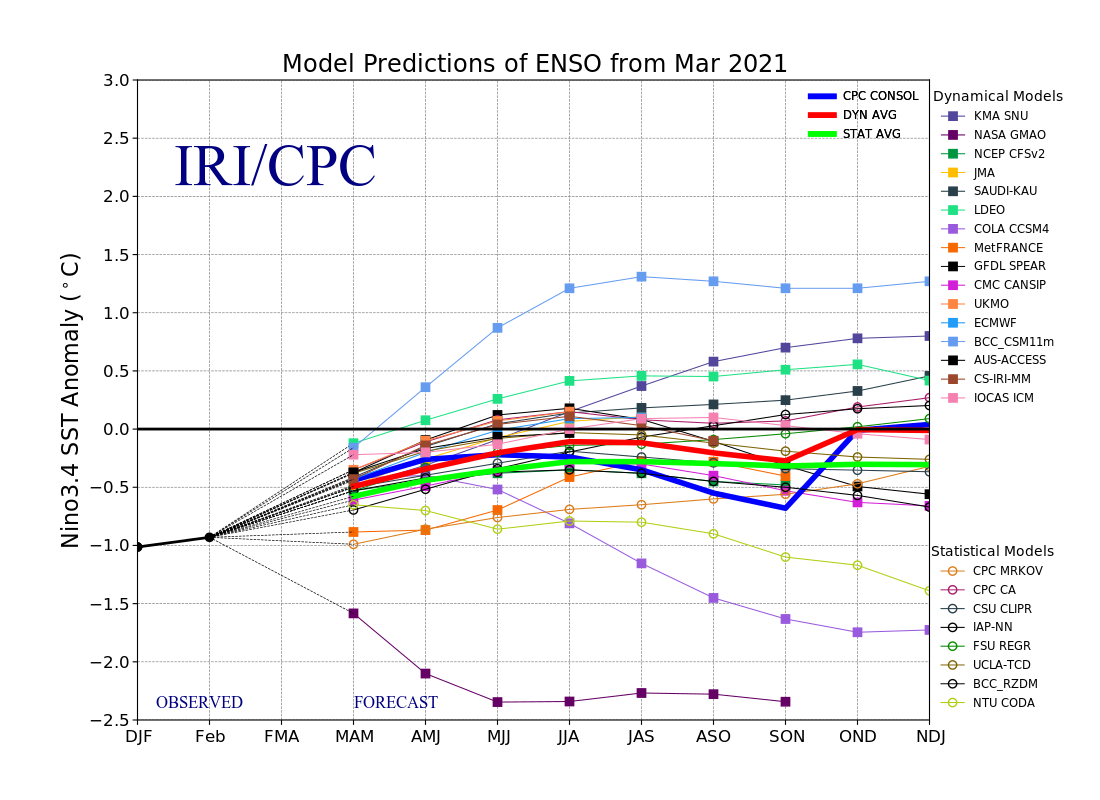 Image 5 reflects the various outcomes with a wide spread in the models. Statistical models lean a little cooler earlier on. Both Dynamical and statistical models averages point to a cool neutral by summer carrying on into fall. 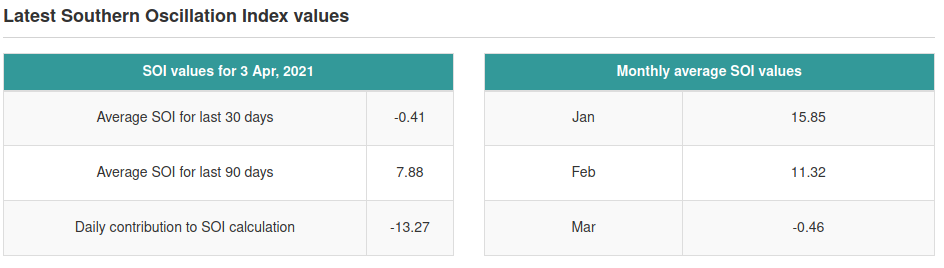 Image 6... SOI reflects the current cluster of invests, current MJO and some stronger storms near a month ago. It has certainly moved away from La Nina. As of 5 days ago the Australian Government Bureau of Meteorology declared La Nina done and conditions neutral based on SOI and the models. NOAA waits til the atmospheric effects take hold on the ocean Sea Surface Temperature in Region 3.4 and then uses the 3 month average there to determine the current ENSO situation.
Overall this year seems to have a thicker spring barrier than some. Neutral looks most likely of the three looking at models and SOI, but extreme temperatures on both ends could easily end up in Region 3.4 over the summer depending on how the Pacific Ocean sloshes and the winds that determine that. Though neither can be ruled out, of the two La Nina looks more likely. If we continue to see a dearth in storms, La Nina especially by the three month ONI standards, may very well remain.
High Risk has been issued.. Have not had two High Risks issued in March since 1991. Be safe out there!
If this page has been open a while...refresh for latest.   
Embed current NEXRAD radar from Wunderground. The Radar with Storm Tracks map shows areas of current precipitation as well as storm tracks, top-of-storm elevation, and areas where severe weather warnings or alerts have been issued.
NCAR/RAL Infrared Satellite
03/24-26/2021 Severe Weather Slideshow
Tornado smashes buildings in Vietnam! Madness! Eyewitnesses filmed from a minimum distance! Watching a cold core low trying to form off of Eastern Central Florida. Above is a stagnate gif from 03/20/2021 2201z. The swirl here is not well stacked and is taking some shear but trying. Models are a little torn about if a low really gets going here or much further North-Northeast. It is expected to move away from land. The 248nmi Melbourne radar doesn't look to hold a whole lot of hope of much rain for ECFL. A brief Look at Drought 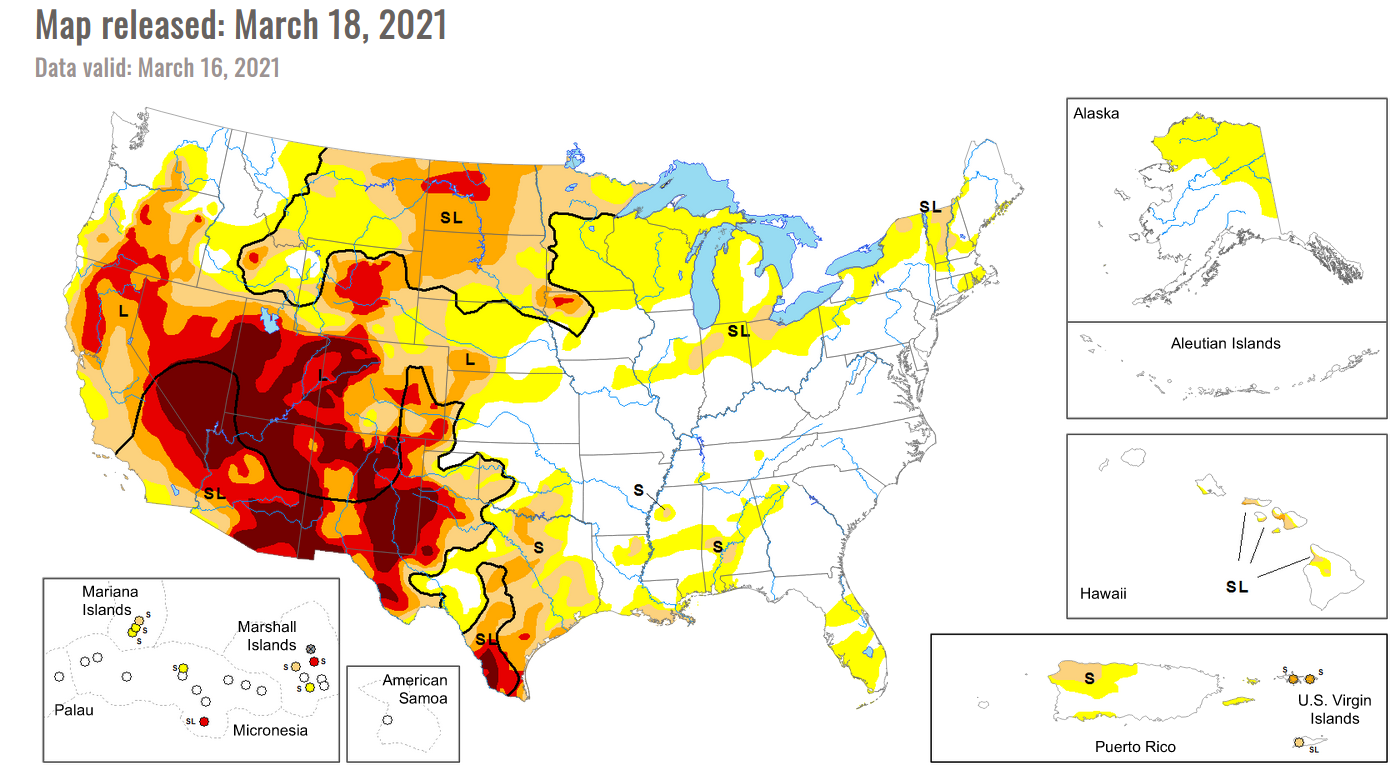 The drought map shows a little improvement this week but much of the drought in the west is looking like it may be around for the long haul in longer range forecasts. Tropics  94S is gone. 95S out in the Southern Indian Ocean (pictured above). It is firing back up and moving West-Southwest. 95S has pulled together a little more, balling it's convection up over the last day. The area of strong convection is overall smaller. Taree one of the hardest hit regions in recent NSW flooding emergencySky News Australia
Harrowing scenes are playing out in Taree on the New South Wales mid-north coast with communities under water as a record-breaking downpour dumps enormous amounts of rain on the region. The area is one of the hardest hit so far in the state’s recent flooding emergency. March: A look Ahead NASA's GMAO S2S_2.1 March Anomaly Forecast is out. In the short term the forecast is warmth for the Arctic, Hudson Bay area and into much of North America. Heavy precipitation is expected in Southeastern Asia, Eastern Africa and much of South America. For North America March is warm around the shores of Alaska and cooler in the interior. This extends thru Western Canada into the Western United States. Eastern and Central Canada could see temperature anomalies of 4C or more. These warm anomalies may come with some precipitation. Not much drought relief is expected in the Deep South or Western United States. Long term outlook forecast this month should be taken with a grain of salt. We are up against the spring barrier with ESNO, that time of year when it's more difficult to predict if El Nino, La Nina or neutral conditions are ahead. S2S shows La Nina strengthening from here, which is also a far outlier in the ENSO models this month. Looking at S2S March historical indices and the most recent ESPI available, a continuation of La Nina wouldn't surprise, maybe not as strong as shown in the March forecast though. The trend this model has stuck with, to have a brief summer reprieve from Arctic heat due to La Nina persists. Slideshow 1: 2 meter Temperature Anomalies (red/hot & blue/cold land) for global, global just March, North America & North America just March. Precipitation Anomalies (green/wet & brown/dry) for global, global just March, North America & North America just March. Sea Surface Temperatures (red/hot & blue/cold for oceans) global. Tropics: Habana is a Long Tracker, Niran Hit New Caledonia Started an image collection of Habana. This became a 35kt storm on 03/04/2021 at 1200z. In 24hrs it strengthened to 115kts, then peaked at 125kts 18hrs later. It weakened a bit and has now regained it's eye. Habana is expected to weaken to around 70kts and then strengthen again in 72hrs to 110kts as it leaves and then reenters warmer water. It's expected to be going strong at the end of the 5 day forecast and to not hit any inhabited islands. Slideshow 2: Habana.. The wind uproots trees! Cyclone Niran hits New Caledonia 300 km / h (185 mph)
Temperature Anomaly Figures 1-3 show NASA's GMAO S2S_2.1 temperature anomaly forecast for Jan - Sep 2021. Compared to last month the expected break in heat for the Arctic has been delayed. The next few months show the Western Hemisphere holding on to the heat as the remaining cold is displaced to Eurasia. La Nina keeps strong through April when it's cooling effects are expected to take more to the atmosphere and temper the temperature a bit. Precipitation Anomaly Figures 4-6 show NASA's GMAO S2S_2.1 precipitation anomaly forecast for Jan - Sep 2021. Globally it shows an overall decline in excessive rain as the year progresses, which is expected in an extended La Nina. Spring planting Season for North America could face some drought issues with an overall dry month of May. The Southeast in particular has been consistently forecast to see a notable drought until June. EL NIÑO/SOUTHERN OSCILLATION (ENSO) ENSO is currently in moderate La Nina conditions, with this week's region 3.4 coming in at -1.2. At the end of January the ONI average should be such this becomes an official La Nina event. The atmospheric conditions are in line with La Nina. Average SOI for the last 30 days is 18.25. The daily contribution for January 5, 2021 is 20.07. 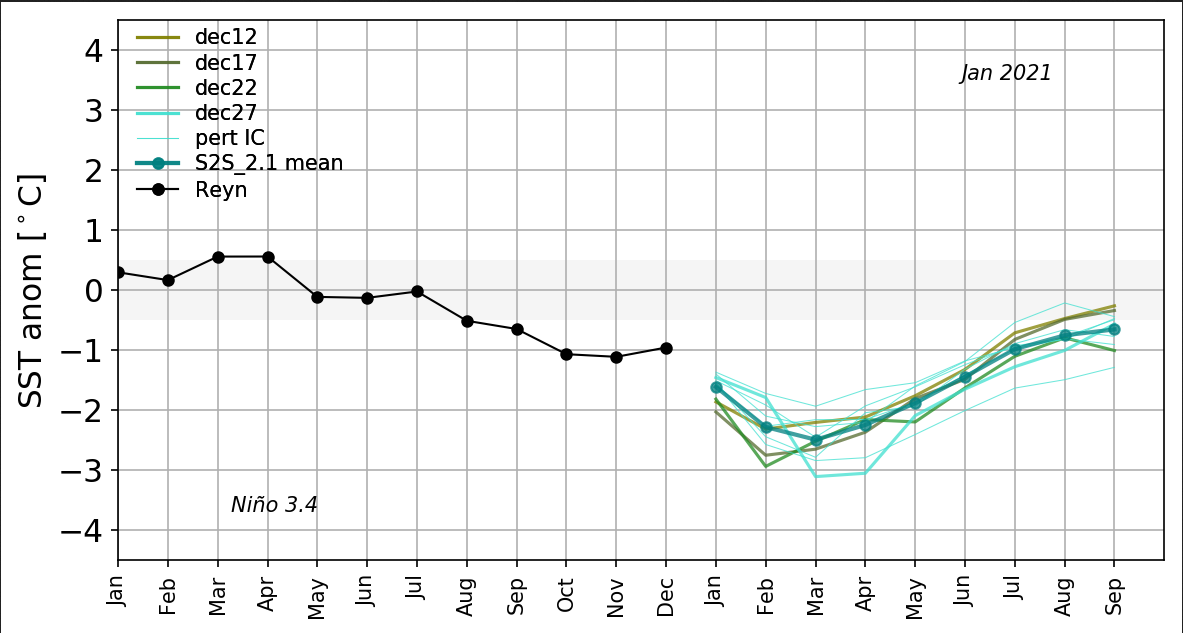 Figure 7. NASA GMAO S2S_2.1 SST anomaly forecast for region 3.4 is denoted by the bold green line. I'm leaning ~0.2C warm of this forecast. The guess is based on it's recent errors caught in the validation process. The general direction of the forecast has been generally correct just a little cold bias. This overall forecasts a strong to very strong La Nina winter, moving into a weak La Nina to possibly cool neutral ENSO conditions by late summer. Volcano Alert Alerts have been issued and resident evacuations on the Eastern Caribbean Islands of St Vincent and the Grenadines are under way. La Soufriere volcano could erupt in less than 24hrs. Authorities are advising that nearby homes should be evacuated immediately. 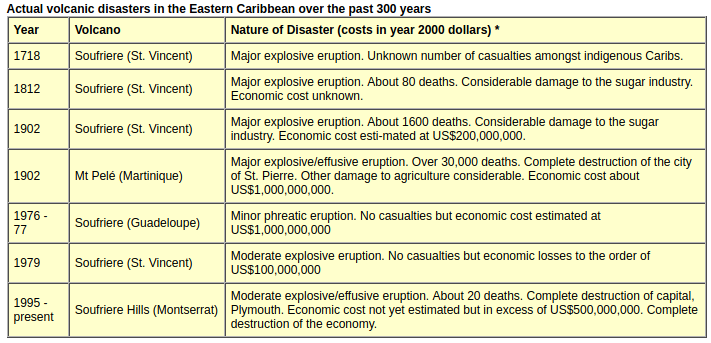 Figure 8. Actual volcano disasters in the Eastern Caribbean from the last 300yrs. Credit: University of the West Indies Seismic Center located in Tobago. Volcano and a Meteor Shower Video 1: Popocatepeti Volacano in Mexico blowing smoke in a meteor shower.
This is a look back through the highlights and notable moments from my 2020 weather folder. Each month is it's own slideshow. Most of these images were downloaded from satellites or radars, some I took, a few friends shared and a handful I don't have any rights to but they somehow found their way into my computer and were thought worthy of sharing again. January Started with Calvinia in the Southern Hemisphere. There was a spectacular Falcon launch that ended in an explosion. A few sections of Trump's wall blew down and my recycling bin blew in the ditch. Rounded this month out with a meme to help some friends see volcanoes were not currently the main producers of Carbon Monoxide. February Snow birds were easily spotted in the mornings on radar. Valentines Day had no ice at the North Pole. Launch! Neighbor's trash can looked to have had a bit too much to drink. The lead cow of a herd that had washed to a different island during Dorian the year before calved. It snowed in Pisgah Forest. March Tornadoes traipsed through as storm season got going. Northeast had a spring nor'easter. Some began preparing for the coming pandemic. Moon and contrails caught together. More things align signalling a worsening state. View from my favorite buoy 41010. Swirl Watch is on as gender reveal parties become the new rage on how to burn it all down. April Honduras and much of Central America burned sending smoke to Florida and the South. Another very severe line of storms came through the south with tornadoes. Earth Day we were reminded areas of bad air pollution were being impacted by corona harsher, as more tornadoes traipsed the land. With the clearer skies rainbows were becoming more common and tornadoes seemed to produce them as well. The first tropical depression formed in the Eastern Pacific. 2020 started to really show what it had as parts of Chernobyl was overtaken by wildfire. Mask production was ramping up. More tornadoes and rainbows as lock down went into week two. It became apparent that the apocalypse handbook has some mistakes. May Amphan brought more flooding to an already hard hit area. Swirl watching continued into my backyard. Eventually a manned Dragon launch occurred after some weather delays and locals struggled with distancing. The New River Flooded and the Sears tower looked alive without power. June Christabol weakened near impact. Another east coastal blob formed. Dolly happened. A tornado came through Tylertown, MS. Friends were sharing rainbows. The dust was notable, 2005 like even. There was a solar eclipse on the other side of the world. More rainbows here. July Dust hazes the sky. Fay came up the east coast. People searched for the comet Neowise. Another infamous 90L formed. Douglas in the Eastern Pacific put on a show. Hanna came for Texas. Isaias moved through the north eastern Caribbean. The governor of Florida was renamed to better suit his leadership style. August Isaias mostly spared Florida despite the memes. Derocho storm swept out electricity. Laura made landfall. Maysak tried to keep the Pacific in the storm totals running. September 99L set the tone for a stormy month as sharks were being removed from power lines in Laura leftovers. Had a Falcon launch. The Smoke from the west was worsening again. 19L formed and then Paulette and Rene. Sally flooded Duval St in the Keys as inhabitants embraced the season & went out anyways. Black Carbon map showing ridiculous smoke as homes burned out west and Sally approached from the south. NWS got in on 2020 doom memes trying to save lives. Sally flooded Pensacola among other places. Teddy formed as did Beta. A blob pulled together and rolled across Florida raising the Indian River to levels most of us had never seen while bringing more rain to an already soggy state. October Was a month of Greek named storms starting with Gamma, who was consummed by Delta. Delta came into the northern Gulf of Mexico with such a surge that some of the storm chasers were left scrambling. Another undesgnated Florida blob slowly gathered and came through. The ground was so wet with rain a few trees fell, including one into a friend's pool. Epsilon and Zeta formed. Zeta also came at the Northern Gulf with a high surge. November Starts with the damage evaluation from the month before. Houses had been rearranged like monopoly pieces and the Gulf of Mexico was trashed. The number of towns and subdivisions lost out west was hard for some to comprehend. 2020 at times overwelmed some into a deep denial of reality. It seemed to peak as election time rolled around. Goni became a Super Typhoon in the West Pacific. Long live Eta formed and danced with Iota, both devistating Central America. Eta lived on to visit Florida and to give one last scare looking like a skull as it encountered the state. Finally a great front came through bringing the start of Winter, which the Georgia Wooly Worms forecast to be warm. December Started off with more blob watching. A few almost pulled it together or persisted long enough.. Most the weather watchers more than had their fill with the 2020 Hurricane Season. The Winter Garden started producing as we settled into watching tropical storms elsewhere like Yasa and Zazu. The conjunction of Saturn and Jupiter challenged amature photographers (including me). We end the year not just looking back, ready to move on but witnessing another one of natures anomolies as a 924.6mb extratropical low has broke the all time low pressure in that region near Alaska.
2020 was a tough year for many. If you made it through you did better than some. RIP to all the weather blog members that passed, my neighbors that didn't make it and to the WeatherUnderground Cat 6 blog. May we all find some peace and meet up again be it in the limbo WU disqus thread, Eye of the Storm at YCC or elsewhere. To a better year! May it be a better one for us all. Yasa Impacts Fiji Harshly for the Holidays
Yasa was a Category 5 cyclone with 177mph winds when it hit Fiji. At least two people died. Many homes and crops were lost. The number of unusually severe storm to hit to this area of the world has been on a notable rise in recent years. Fiji Prime Minister Frank Bainimarama, and Genevieve Jiva, the secretary for the environmental NGO 350 in Fiji, are both calling for climate justice and action. https://www.cnn.com/2020/12/17/weather/cyclone-yasa-damage-intl-hnk/index.html
Cold Front Coming to the East
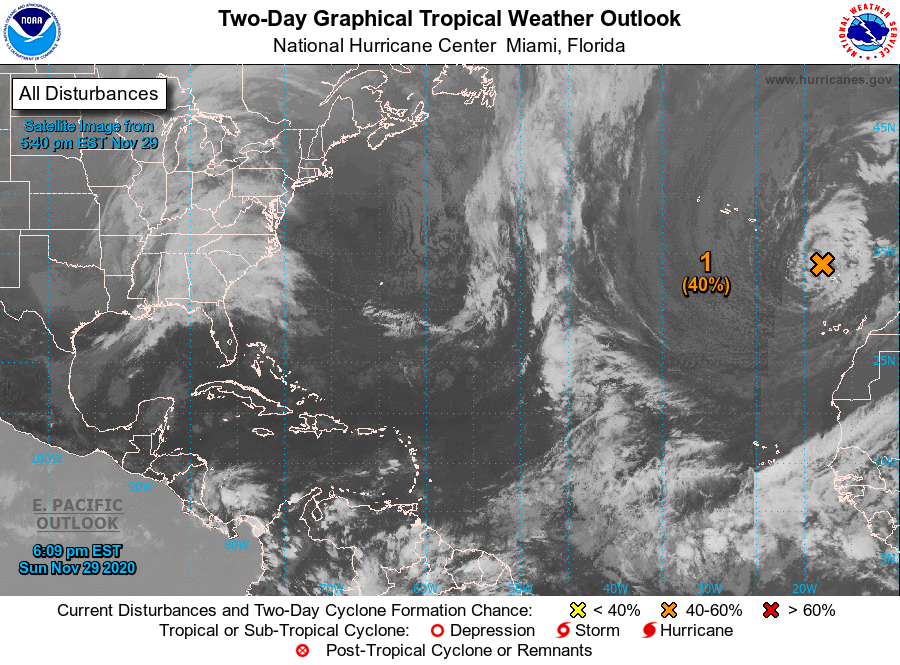
90L in the Northeast Atlantic
Left is a Modis pass of 90L earlier today as it pulled together a little. National hurricane Center gives 90L a 40% chance to become a subtropical storm before conditions deteriorate after a few days. It is expected to wander north of the Canary Islands and affect Madeira Island with strong winds and heavy rains Monday and Tuesday.
Indonesia Volcano Unrest Increases
Lewotolo Volcano erupted this morning in southern Indonesia (Indonesia MAGMA). According to Relief Web the eruption sent ash over 50,000ft into the atmosphere. 12,500 people live within the extreme 10km danger zone. Near 500,000 live close enough to be impacted.
Three other volcanoes are at the highest danger threat level: Mount Sinabung in North Sumatra, Mount Merapi on the border of Yogyakarta and Central Java (just elevated today) and Mount Karangetang in North Sulawesi. |
Current Tropics and Weather News..
Archives
January 2022
|
 RSS Feed
