|
Welcome to Skyepony's Weather Blog.
|


|
Melbourne was chaotic today with storm plans going into action. The roads were crazy. No water was the most frequent report. Some gas lines and stations without. Near a third of the houses in the neighborhood are shuttered.
From yesterday's blog Cooper's Island of the Virgin Island's was the first of the three cameras posted to come back online after the passage of Dorian. Included today is a live buoy that Dorian should pass near. More nearby ships and buoys can be found here. As of 12z 8/30 UKMET model is still winning on Dorian. That family of models has ~70-90nm of error at 3 days. OFCL has improved from yesterday but still lags UKMET suite with 138.7nm of error at 3 days. Average intensity for all the models is still running over, at 3 days average intensity error is over by 19.1kts. Refresh or revisit for current.   National Hurricane Center   MIT, Emanual Station 41046 - EAST BAHAMAS - 335 NM East of San Salvador Is, Bahamas 
Comments
Florida Preps
It is currently looking pretty doom for the Space Coast but note the cone is wide, uncertainty is still in play. All along the East Coast of Florida and Georgia should think over their storm plans. Today is the day to do things you would have to do anyways, laundry, cleaning, outdoor pick up. Is it going to be a Labor Day Party or a Hurricane Party?...the supplies aren't too different. But plan for both. It's a good time to make back up Evacuation Labor Day Party plans if you usually have to leave. Don't forget the pets needs. Most of the Florida Peninsula is forecast for several inches of rain over the next week. Clear drains and ditches.
Model Verification
Looking at model verification for Dorian, the UKMET family is in the lead. OFCL led until the 12Zruns. Overall storm model performance has been some what poor. The big jump north it took after reforming from hitting some Windward Islands really added to overall error. Average models error at 2 days is 99.8 nautical miles, 3 day error is 164.5nm. EGR2, which is the UKMET model Interpolated 12 hours, has an error of 46.2nm at 3 days. Another close model in the UKMET family, the EGRI is running 2nd with 3 day error at 54.8nm. UKX2 which is UKMET [GFS tracker] (Interpolated 06 hours) has an error of 57.5nm at 3 days. Rarely do we see a model outdoing the Official Forecast, but that is the current case. OFCL has 62.2nm error at 3 days. They are not far off the lead & certainly the one to watch as Dorian gets past the islands.
Refresh blog for current information, graphics and data as they update. National Hurricane Center MIT, Emanual COOPER ISLAND, British Virgin Islands WU_2960923 Southeast, USA Virgin Islands SEAIT75 Near LAQUILLO, PUERTO RICO 12aa34
08/22/19 The last area of interest eventually became Chantal and is now well out in the Atlantic. Now the Bahamas is producing another. 98L is pulling together and looking to bring at least some rain to Florida this weekend.
These are self updating graphics. Refresh page for latest info. 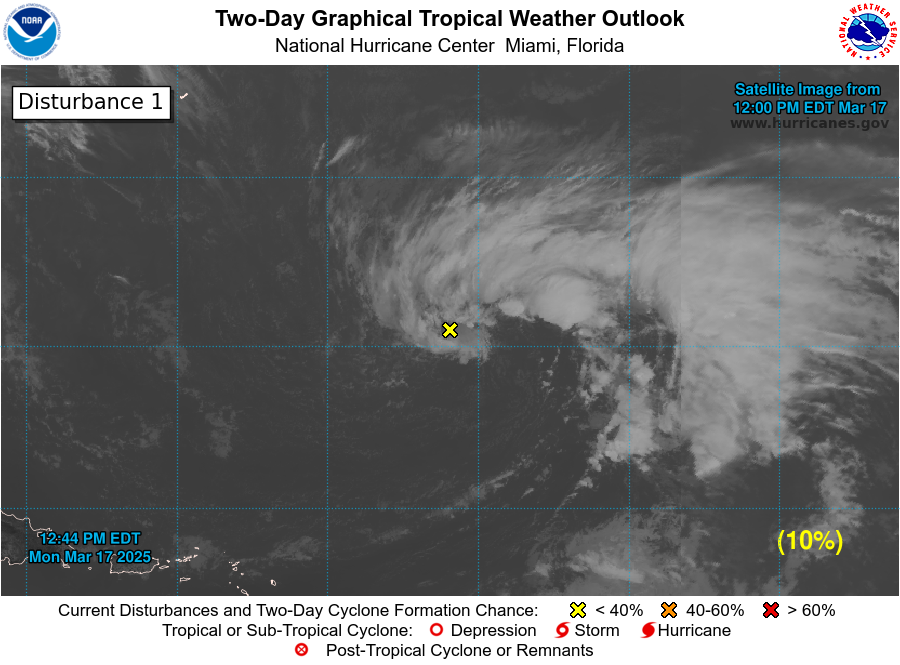 NHC  NHC Atlantic 5-Day Graphical Tropical Weather Outlook ~~~~~~~~~~~~~~~~~~~~~~~~~~~~~~~~~~~~~~~~~~~~~~~~~~~~~~~~~~~~~~~~~~~~~~~ Weather Prediction Center~ Seven Day Quantitative Precipitation Forecast 
Back in May it didn't look like an active hurricane season nigh with El Nino and previous years when the Midwest and Canada had such flooding, which seems to correlate with so few Atlantic hurricanes. Sea Surface Temperatures (SST) are higher and as El Nino has faded it is time to look at the other forcing factors. An overlooked but cyclone feeding force, Sea Surface Salinity (SSS) looks out of whack with the Atlantic over all in a none cyclonic conducive saline state. It's anomalously high in much of the Atlantic & modeled to continue to be.. Boundary layers of fresh water trapped at the surface help kick off hurricanes. We usually have some flowing off South America feeding the Main Development Region (MDR). There is a little, with some flowing, but overall for the Atlantic it's average to more saline this year. It's another signal that what does form this season is more likely to do so closer to land & the runoff from the land floods that have been occurring. High salinity areas are a symptom of evaporation being more prevalent than precipitation. High density/saline water at the surface has been shown to mix much faster and cool quicker as a storm forms or crosses. Where if you get fresh/less dense/less saline trapped over dense/high salinity you get that stable boundary layer that doesn't mix well...the high temps then get fed to a storm with less up-welling, aiding Rapid Intensification (RI). The SST are above average in the Atlantic & really most of the globe. We've seen though it takes more than high SST to get an active season. The way it's modeled high SST should persist but so should high SSS for the Atlantic which shows this model indicates that much evaporation and less rain will continue to occur over much of the Atlantic this season. Running the analog ENSO years to August numbers and leaning toward moving toward La Nina gives these years and their storm numbers, Tropical Depressions-Tropical Storms-Hurricanes-Major Hurricanes: 1958 12-12-7-3 1983 7-4-3-1 1960 14-11-7-3 1992 10-7-4-1 So far 2019 has had 3-2-1-0. I'll stick with my forecast of 11-9-4-3, though wouldn't be surprised if it ends a little low overall or high for Major Hurricanes. Looking at vertical instability charts enforces the greater chances of storms forming along the East Coast, Gulf of Mexico or Caribbean. 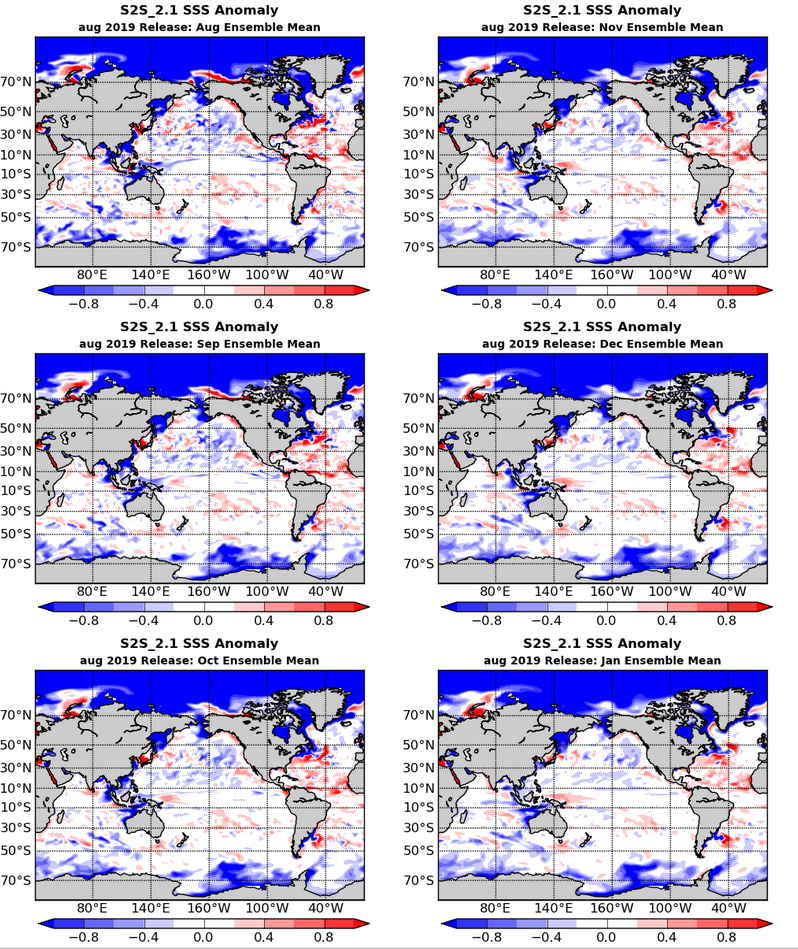 Figure 1. GMAO S2S_2.1 Sea Surface Salinity Forecast 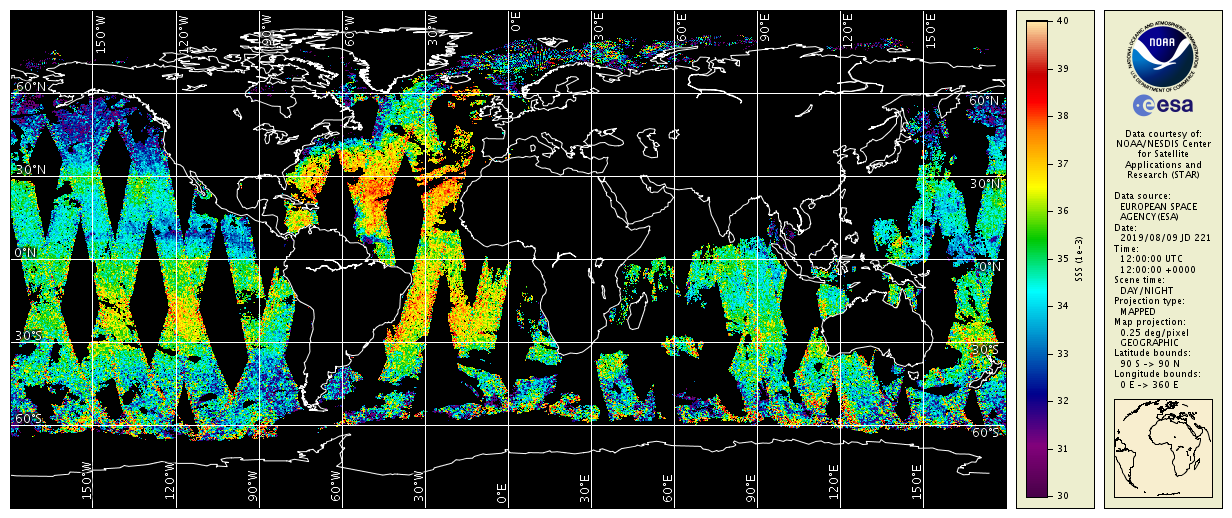 Figure 2. NOAA 08/09/2019 Sea Surface Salinity More research and articles about Sea Surface Salinity effects on tropical cyclone formation. Fresher ocean water can boost hurricanes AGU has an interesting write up about various studies and findings world wide on salinity and cyclones. Here is an excerpt: The impact and response of the ocean during the passage of a tropical cyclone may also be influenced by the ocean salinity stratification and barrier layer thickness (BLT). When the halocline is shallower than the thermocline, a layer is established between the density mixed layer depth (MLD) and the temperature mixed layer (ILD or Isothermal Layer Depth) which is known as the barrier layer. Several studies have reported the importance of barrier layers related to TC [Sengupta et al., 2008McPhaden et al., 2009].Wang et al . [2011] observed that the pre-existence of BLT can inhibit cyclone induced cooling in the surface and subsurface layers by vertical mixing. Pailler et al. [1999] analyzed high vertical resolution measurements of salinity and temperature to show that high SSTs in the northwest Tropical Atlantic are often associated with low sea surface salinity and thick BLT (grater than 40 m). Balaguru et al. [2012] examined the effect of BLT on TC inten-sification to show that in the presence of a thick BLT and a favorable atmosphere, tropical storms are energized. Though Sea Surface Salinity isn't the only factor or the most important, it's a historically harder weather data set to gather and an understudied one that is currently more out of balance than most years. This may be an opportunity to test how much this factor can regulate the cyclone switch & improve intensity forecasts. Krosa Close Up.. Krosa is moving Northwest and should impact Southern Japan Thursday morning.  |
Current Tropics and Weather News..
Archives
January 2022
|
 RSS Feed
