|
Welcome to Skyepony's Weather Blog.
|


|
Back in May it didn't look like an active hurricane season nigh with El Nino and previous years when the Midwest and Canada had such flooding, which seems to correlate with so few Atlantic hurricanes. Sea Surface Temperatures (SST) are higher and as El Nino has faded it is time to look at the other forcing factors. An overlooked but cyclone feeding force, Sea Surface Salinity (SSS) looks out of whack with the Atlantic over all in a none cyclonic conducive saline state. It's anomalously high in much of the Atlantic & modeled to continue to be.. Boundary layers of fresh water trapped at the surface help kick off hurricanes. We usually have some flowing off South America feeding the Main Development Region (MDR). There is a little, with some flowing, but overall for the Atlantic it's average to more saline this year. It's another signal that what does form this season is more likely to do so closer to land & the runoff from the land floods that have been occurring. High salinity areas are a symptom of evaporation being more prevalent than precipitation. High density/saline water at the surface has been shown to mix much faster and cool quicker as a storm forms or crosses. Where if you get fresh/less dense/less saline trapped over dense/high salinity you get that stable boundary layer that doesn't mix well...the high temps then get fed to a storm with less up-welling, aiding Rapid Intensification (RI). The SST are above average in the Atlantic & really most of the globe. We've seen though it takes more than high SST to get an active season. The way it's modeled high SST should persist but so should high SSS for the Atlantic which shows this model indicates that much evaporation and less rain will continue to occur over much of the Atlantic this season. Running the analog ENSO years to August numbers and leaning toward moving toward La Nina gives these years and their storm numbers, Tropical Depressions-Tropical Storms-Hurricanes-Major Hurricanes: 1958 12-12-7-3 1983 7-4-3-1 1960 14-11-7-3 1992 10-7-4-1 So far 2019 has had 3-2-1-0. I'll stick with my forecast of 11-9-4-3, though wouldn't be surprised if it ends a little low overall or high for Major Hurricanes. Looking at vertical instability charts enforces the greater chances of storms forming along the East Coast, Gulf of Mexico or Caribbean. 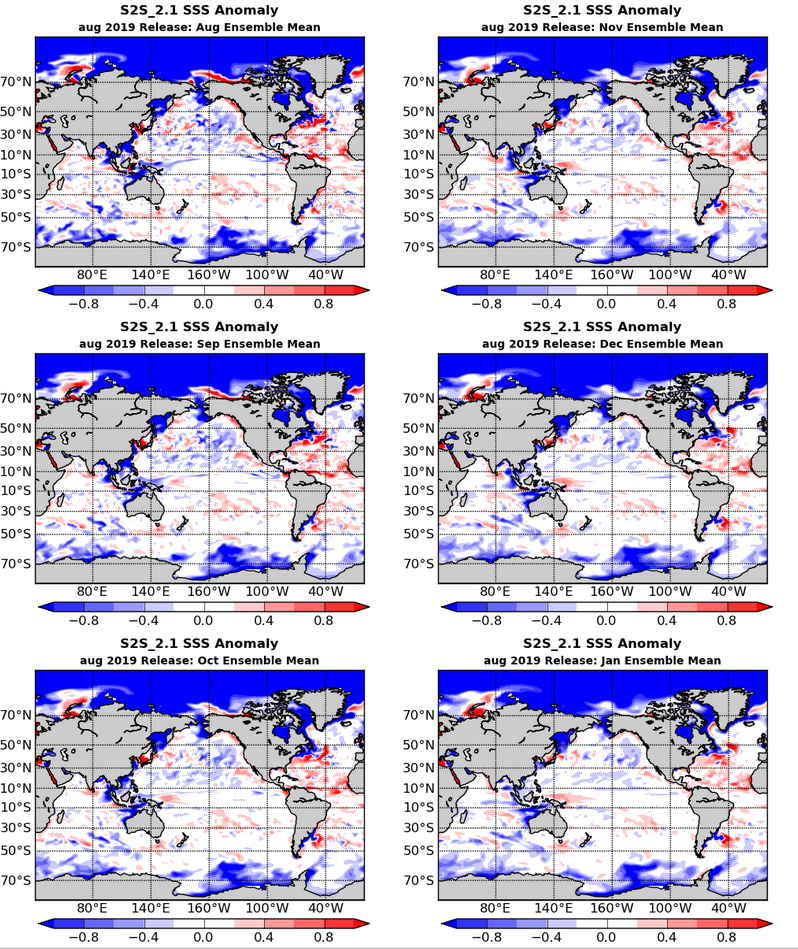 Figure 1. GMAO S2S_2.1 Sea Surface Salinity Forecast 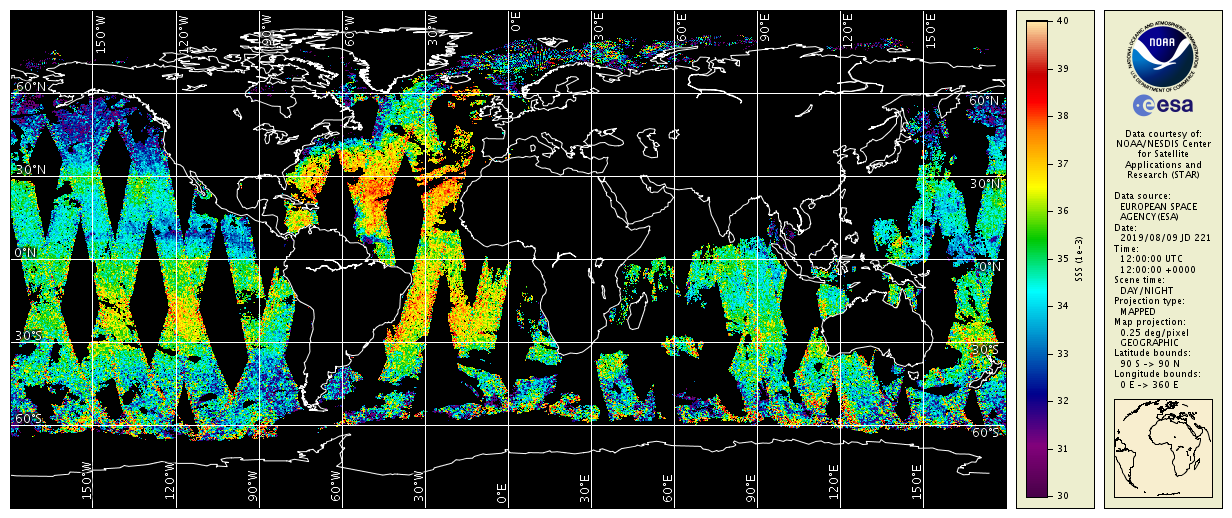 Figure 2. NOAA 08/09/2019 Sea Surface Salinity More research and articles about Sea Surface Salinity effects on tropical cyclone formation. Fresher ocean water can boost hurricanes AGU has an interesting write up about various studies and findings world wide on salinity and cyclones. Here is an excerpt: The impact and response of the ocean during the passage of a tropical cyclone may also be influenced by the ocean salinity stratification and barrier layer thickness (BLT). When the halocline is shallower than the thermocline, a layer is established between the density mixed layer depth (MLD) and the temperature mixed layer (ILD or Isothermal Layer Depth) which is known as the barrier layer. Several studies have reported the importance of barrier layers related to TC [Sengupta et al., 2008McPhaden et al., 2009].Wang et al . [2011] observed that the pre-existence of BLT can inhibit cyclone induced cooling in the surface and subsurface layers by vertical mixing. Pailler et al. [1999] analyzed high vertical resolution measurements of salinity and temperature to show that high SSTs in the northwest Tropical Atlantic are often associated with low sea surface salinity and thick BLT (grater than 40 m). Balaguru et al. [2012] examined the effect of BLT on TC inten-sification to show that in the presence of a thick BLT and a favorable atmosphere, tropical storms are energized. Though Sea Surface Salinity isn't the only factor or the most important, it's a historically harder weather data set to gather and an understudied one that is currently more out of balance than most years. This may be an opportunity to test how much this factor can regulate the cyclone switch & improve intensity forecasts. Krosa Close Up.. Krosa is moving Northwest and should impact Southern Japan Thursday morning. 
Comments
Barely pulled together a last look and final forecast for the 2019 Hurricane Season after chasing the heat wave and great tunes around Florida. Started with the Frontier Weather, Inc ENSO Weather Analog Calculator. With updated averages and a slightly warmer looking forecast the analog years came out as pictured below. 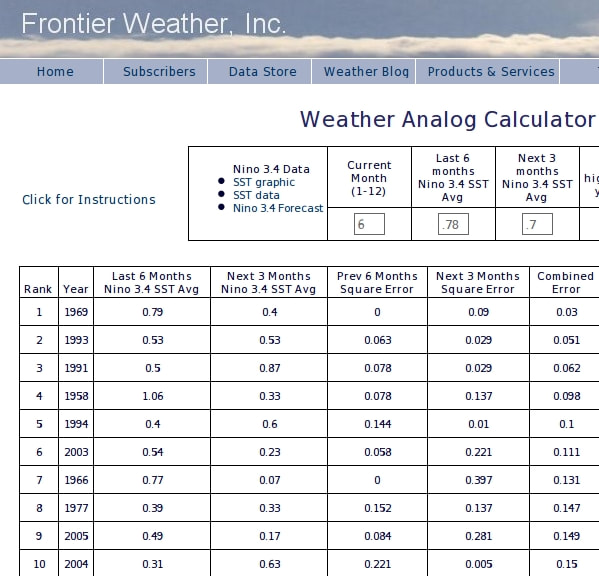 Really only considered the top five and 1927. The flooding in the midwest and Canada has been most comparable to this year. 1993 is in there, another flooded year for that region. Did toss the number 1 for being a bit of an outlier, year of Camile. 1969 20-18-12-5 1993 10-8-4-4 1991 12-8-4-2 1958 12-12-7-3 1994 14-9-3-0 1927 10-8-4-1 Years with higher rains and tornadoes in the Midwest tend to have less storms. The Atlantic is over due for less storms. The cyclone switch seems off now with the storms on land mode in place. Even though shear is falling Vertical Instability seems low in most areas. The Atlantic has already seen it's first Tropical Storm of the year. Looking through the other analog years, the first storm could be in May or in August. So with less confidence than some years, went with 11-9-4-3. Overall there was less method and scrutiny applied than in some years. The Midwest flooding weighted heavy this year. Looking at the Vertical Instability and Sea Surface Temperatures the areas of greatest risk looked to be the East Coast, followed by the Caribbean and Gulf of Mexico. Florida Tax Free Hurricane Shopping Now is the time to storm prep. Tax holiday for hurricane supplies runs from May 31st through June 6th.
|
Current Tropics and Weather News..
Archives
January 2022
|
 RSS Feed
